• This is default featured slide 1 title

    Go to Blogger edit html and find these sentences.Now replace these sentences with your own descriptions.This theme is Bloggerized by NewBloggerThemes.com.

  • This is default featured slide 2 title

    Go to Blogger edit html and find these sentences.Now replace these sentences with your own descriptions.This theme is Bloggerized by NewBloggerThemes.com.

  • This is default featured slide 3 title

    Go to Blogger edit html and find these sentences.Now replace these sentences with your own descriptions.This theme is Bloggerized by NewBloggerThemes.com.

  • This is default featured slide 4 title

    Go to Blogger edit html and find these sentences.Now replace these sentences with your own descriptions.This theme is Bloggerized by NewBloggerThemes.com.

  • This is default featured slide 5 title

    Go to Blogger edit html and find these sentences.Now replace these sentences with your own descriptions.This theme is Bloggerized by NewBloggerThemes.com.

How to Link PAN Card with Aadhaar Card?

There are two ways through which you can link PAN and Aadhaar. These are:
  • Through the Income Tax e-filing website
  • Sending an SMS to 567678 or 56161

Deadline for linking PAN Card with Aadhar is 31 December 2019

The deadline to link your Permanent Account Number to your Aadhaar card has been extended from 30 September 2019 to 31 December 2019 as per the Central Board of Direct Taxes. This is the seventh time the Income Tax Department has extended the last date for linking of the PAN card with the Aadhaar card since early this year.
The Central Board of Direct Taxes issued the statement regarding the further extension of the deadline on Friday, 27 September 2019.


Linking PAN with Aadhaar through the e-filing website

  • Provide the PAN, Aadhaar number, and name as mentioned in the Aadhaar card
  • Tick the square if only the birth year in mentioned in the Aadhaar card
  • Enter the Captcha code. (Visually challenged users can request for an OTP instead of the captcha code. The OTP will be sent on the registered mobile number)
  • Click on the 'Link Aadhaar' button.
Link aadhar card with pan


Linking PAN with Aadhaar by sending an SMS

The PAN can be linked with the Aadhaar number by sending an SMS to 567678 or 56161 from the registered mobile number. In order to do so, you need to type UIDPAN<12-digit Aadhaar><10-digit PAN> and send it.
Share:

Aditya Birla Sun Life PSU Equity Fund

DEAR SIR/Madam,

આદિત્ય બિરલા સન લાઇફ મ્યુચ્યુઅલ ફંડ રૂપિયા ૧૦ થી મળતા યુનિટ ની નવી યોજના લાવી રહ્યું છે

આદિત્ય બિરલા સનલાઇફ પીએસયુ ઇક્વિટી ફંડ

પીએસયુ  થીમ ને અનુસરતી ઓપન એન્ડેડ  ઇક્વિટી સ્કીમ
 
 એનએફઓ અવધિ: 9 ડિસેમ્બર'19 - 23 ડિસેમ્બર 19

 ફંડ મેનેજર: મહેશ પાટીલ / વિનીત માલુ
 બેંચમાર્ક: એસ એન્ડ પી બીએસઈ પીએસયુ ટીઆર ઇન્ડેક્સ

 ફંડનાં લક્ષણ

 મોટા પ્રમાણમાં સેક્ટર-ઓઇલ, ગેસ, પાવર, માઇનીંગ, બી.એફ.એસ.આઇ., સંરક્ષણ અને ઇજનેરી પર ધ્યાન કેન્દ્રિત
 25-30 શેરોમાં રોકાણ.
 🎯 માર્કેટ કેપ બાયસ- (60-70%) લાર્જ કેપ, સ્મોલ અને મિડકેપ (20-30%).

 રોકાણ ફિલોસોફી

ચૂંટેલા સ્ટોક્સ માટે ફીટ બોટમ અપ એપ્રોચ.

 ફ્યુચર ગ્રોથ અને ટકી રહેવાની સંભાવના સાથે હાઇ ડિવિડન્ડ યિલ્ડ જાળવવા હાઈ રીટર્ન ઇક્વિટી અને સસ્ટેનેબલ કેશ ફ્લો સાથે પીએસયુ કંપનીઓ પર આધારિત સ્ટોક સિલેક્શન.

 સરકારનું મિનિમમ 25% હોલ્ડિંગ અથવા સરકાર એકમાત્ર સૌથી મોટો ધારક હોવા સાથે, ડિસઇન્વેસ્ટમેન્ટ કરવામાં આવે છે તેવી કંપનીઓને હોલ્ડ કરવાનું

 આ ફંડ નોન પીએસયુ તકોમાં 20% સુધી લાભ લઈ શકે છે.  

 એબીએસએલ પીએસયુ ઇક્વિટીમાં કેમ રોકાણ કરવું
 -ક્વાસી એકાધિકારિક સ્થિતિ અને કોર સેક્ટરમાં મોટી હાજરી.
 ડીએકડ લો લેવલ પર PSU સ્ટોક વેલ્યુએશન, તેમના લાંબા ગાળાની સરેરાશ કરતા 30% કરતા વધુ નીચા ભાવે PSU શેરો‌ ઉપલબ્ધ છે
 🎯 મોટાભાગના પીએસયુ એ સ્ટ્રોંગ બેલેન્સ શીટવાળી ગુણોવાળી કંપનીઓ છે અને રિરેટ થવાની સંભાવના છે.
 🎯 પીએસયુ કું. ની ઉંચી ડિવિડન્ડ યિલ્ડ ૩% -‌ ૮% સાથે મજબૂત આરઓઇ અને હાઇ કેશ ફ્લો ધરાવે છે, તેની સરખામણીએ ૧.૦૦% -૧.૫૦% ની નિફ્ટી ૫૦ ની યિલ્ડ છે.
 માર્કેટ સહભાગીઓ દ્વારા સંચાલિત આગામી ૩-૫ વર્ષ માટે રોકાણની ચક્રીય તક છે.
 🎯 સરકાર  વ્યૂહાત્મક ડિસઇન્વેસ્ટમેન્ટ વેલ્યુએશન રેટિંગ અને સુધારેલી કાર્યક્ષમતાના સંયોજન સાથે મૂલ્યને અનલક કરી શકે છે.

 રોકાણનો ચેક  "એબીએસએલ પીએસયુ ઇક્વિટી ફંડ" ની તરફેણમાં લેવાનો રહેશે

 મિનિમમ.  રોકાણ-રૂ .૫૦૦, લમ્પસમ અને એસઆઈપી બંને માટે, ત્યારબાદ રૂ .૧ ના ગુણાકમા.

 એક્ઝિટ લોડ: 3 મહિનાની અંદર ૦.૫૦%

CONTACT NOW !!!!!

Robin Gohil
9974372131
Share:

How to choose a good fund for SIPs

If your SIPs are not delivering, it could be due to a poor choice of fund. Here is how you can pick a good equity fund for your SIPs


Today most investors are aware of the importance of SIPs as a wealth-building tool. But many investors also want to know why their 'SIPs' are not making money. The reasons for this could be many. Perhaps the market has been falling since you invested in your SIPs; or perhaps you did SIPs in a rising market and it is now falling; or perhaps it's been just a couple of months since you have been investing through SIPs. One reason that stands out is that you made a wrong choice of fund.
Interestingly, the fact that they may have chosen a wrong fund surprises investors. That's because investors don't see SIPs as a method but as a vehicle. Hence, when they are asked about where they are investing, they often say 'in SIPs'. In reality, SIPs are just a method of investing, where you invest systematically in an equity fund. By doing so, you reduce the chances of investing all your money at a market high and you get to average your overall cost. When the market is falling, your SIPs get you more units of an equity fund. When the market is rising, you automatically buy fewer units. Above all, SIPs help you invest in a disciplined manner and create a large corpus with small investments. But if you have invested in a fund that has historically trailed its category, you are likely to get sub-optimal returns even if you invest through SIPs. Hence, choosing the right fund is absolutely important. How can one do that? Here are a few guidelines:
Choose the right category: There are many types of equity funds depending on where they invest. First select the ones most appropriate for your requirement. Some predominantly invest in large caps, some in mid caps; some invest in just one sector or theme. Multi-cap funds can invest across companies of all sizes and hence can tap the market opportunities better. Those who are willing to take extra risk for extra returns can also explore mid- and small-cap funds. If you are looking to save tax, you can pick a tax-saving fund.
Assess the long-term returns: One mistake that investors make while assessing an equity fund is that they focus too much on recent returns. A fund can clock higher gains owing to risky bets or momentum plays that work in the short term but backfire eventually. Hence, see historical returns over the long run - five years, ten years and so on. It's also important to see how much the fund has lost in a bad phase, such as 2008. An ability to contain downside is a desirable trait in a fund.
Check the stability of fund management: Check the tenure of the current fund manager. If the fund manager has been around for many years, that's generally a positive. That's because an experienced fund manager has been through many market phases and knows how to steer the fund during tough times. Consistency in management style also tells investors what they can expect from the fund.
Compare expenses: Over the long term, fund expenses can make a difference to your overall returns. Hence, do check them. But don't make them the most important criterion of selection. If you can pick funds yourself and track their performance, you can go for direct plans, which don't involve distributor commission. However, if you need the assistance of an advisor or a distributor to keep you on track, it's better to invest in a regular plan.
Finally, when it comes to equity funds, always take the SIP route. Combined with a good fund, SIPs can help you maximise your returns over the long term.
Share:

Start Saving

Share:

UNDERSTANDING RETURNS FROM MUTUAL FUNDS


UNDERSTANDING RETURNS FROM MUTUAL FUNDS 

MEASURING PERFORMANCE

While looking at a mutual fund scheme's performance, one must not be led by the scheme's return in isolation. A scheme may have generated 10% annualised return in the last couple of years. But then, even the market indices would have gone up in similar way during the same period. Under-performance in a falling market, i.e. when the NAV of the scheme falls more than its benchmark (or the market), is the time when you must review your investment.

One must compare the scheme's return as against its benchmark return. It is better to be rid of investment in a scheme that consistently under-performs as compared to its benchmark over a period of time, from one's portfolio. It is important to identify under-performers over the longer time horizon (as also out-performers).

In addition, one may also consider evaluating the 'category average returns' as well. Even if a scheme has outperformed its benchmark by a decent margin, there could be better performers in the peer group. The category average returns will reveal how good (or bad) is one’s investment is against its peers which help in deciding whether it is time shift the investment to better performers.

One may be holding a too little or too much-diversified portfolio. Even the expense ratio of some of the schemes that one could be holding may be high compared to others within the same category.

Most importantly, the review helps an investor validate if the investments are aligned to his/her goals.

HOW OFTEN SHOULD ONE REVIEW

One should avoid the temptation to review the fund's performance each time the market falls or jumps up significantly. For an actively-managed equity scheme, one must have patience and allow reasonable time - between 18 and 24 months - for the fund to generate returns in the portfolio.

The review may become more pronounced in case of thematic or sectoral schemes as they are more prone to the changing economic environment.

It is advisable for common investors to make a separate watch list of funds that are found to be underperforming their benchmark or their comparable peers. From this list, one should look for improvement in performance over the subsequent 2-3 quarters. A consistent under-performance over 3-4 quarters may warrant shifting the investment to other better options. One needs to even check the reason for the under-performance, which may be expressed in the fund manager's commentary. The underlying stocks in the portfolio of an MF scheme keep changing and along with it change the associated risks. An important factor is the risk metrics. If the risk profile of the fund has skewed further towards "High" risk while the returns remain the same or do down, it may be advisable to exit the fund.

Therefore, a review of the fund's risk-adjusted return, i.e., a measure to find how much return an investment will generate given the level of risk associated with it, could be more helpful.
As an investor, high return at low risk is always preferable. Hence, MF schemes with high risk-adjusted returns are most sought-after. Risk-adjusted returns are well captured by several rating agencies.

The winners of today may not continue with the winning streak year after year. In other words, reviewing the performance as mentioned above may not always be fruitful. Moreover, tracking and reviewing of a scheme's portfolio is quite different from reviewing one's own portfolio. A mutual fund investor should not worry themselves about the portfolio of a fund. That's the fund manager's job.

WATCH OUT

Be mindful not to disrupt your overall portfolio allocation, while redeeming units from equity mutual fund schemes, as the redemption proceeds would have to be re-deployed in another equity scheme which will require undergoing the entire process of choosing the right scheme to invest in. Try to maintain the original levels of exposure to equities, unless your allocation needs a change.

Frequent review and tracking of mutual fund returns may tempt you into taking unwarranted impulsive decisions. Do not let an fall in NAVs tempt you to discontinue SIPs or redeeming units from a fund. When there are market falls steeply, try to invest lump-sum amount. An annual review comparing the fund with the benchmark as well as with the category peers will certainly help and advisable.


CALCULATING RETURNS ON MUTUAL FUND UNITS

There are many ways to calculate returns from mutual fund investments. Two of the most popular methods are Absolute returns and Annualised returns.

Absolute returns

Absolute return is the simple increase (or decrease) in your investment in terms of percentage. It does not take into account the time taken for this change.

So if an investment’s current market value is Rs. 5,25,000 and your invested amount was Rs. 2,75,000 then your absolute return will be: [(5,25,000-2,75,000)/2,75,000] = 90.9%

Notice how irrelevant the date of investment or date of redemption is. Ideally, you should use the absolute returns method if the tenure of your investment is less than 1 year.

For periods of more than 1 year, you need to annualise returns; which means you need to find out what the rate of return is per annum.

Annualised returns

A Compound Annual Growth Rate (CAGR) measures the rate of return over an investment period. It is a smoothened rate because it measures the growth of an investment as if it had grown at a steady rate, on an annually compounded basis.

CAGR = [(Current Value / Beginning Value) ^ (1/# of Years)]-1

How can I find the CAGR using the computer?
To calculate a CAGR, use the XIRR function in MS Excel.

8-Jan-061,00,000Enter the date and the investment value
31-Dec-122,00,000Enter the current value and the current date
XIRR formula10.43%

Please remember to put a negative sign as the XIRR formula calculates the return on cash flows. Thus to find returns there has to be a cash inflow and cash outflow, which should be indicated with the use of positive and negative signs.

ACTIVELY MANAGED FUNDS AND PASSIVELY MANAGED FUNDS

Actively managed funds are those where the fund manager actively manages these funds and buys or sells stocks of companies as per the broad guidelines that have been enumerated in the scheme information document sells stocks. These funds don’t mimic the index but buy and sell on basis of the research of the fund manager.

Passive funds on the other hand look at offering returns by mimicking an index like a BSE or Nifty. The whole point of Index fund is to follow a certain benchmark, and therefore they are called passively managed funds.

UNDERSTANDING ALPHA. HOW DOES IT MEASURE THE FUND MANAGER’S CONTRIBUTION?

But how can I measure the fund manager's contribution to performance?

This brings us to the question, how exactly can you measure a fund manager’s contribution to performance? Alpha measures the performance due to stock selection. It is the difference between the return you would expect from a fund, given its beta and the return it actually produced. If the fund returns more than its beta would predict, it has a positive alpha and if it returns less than the amount predicted by the beta, that would mean that the fund has a negative alpha.

A positive alpha is the extra return would be awarded to you for taking a risk, instead of accepting the market return.

UNDERSTANDING BETA

Beta measures the volatility of a security relative to something, usually a benchmark index. A beta greater than one means the fund or stock is more volatile than the benchmark index, while a beta of less than one means the security is less volatile than the index.

If the market goes up by 10%, a fund with a beta of 1.0 should go up 10% and vice versa. While standard deviation determines the volatility of a fund according to the disparity of its returns over a period of time, beta, determines the volatility, or risk, of a fund in comparison to that of its index or benchmark.

Beta is based on the capital assets pricing model which states that there are two kinds of risk in investing in equities- systematic risk and non-systematic risk. Systematic risk is integral to investing in the market and cannot be avoided. Eg. risk arising out of inflation and interest rates. Non-systematic risk is unique to a company - can be mimimised by diversification across companies. Since non-systematic risk can be diversified, investors need to be compensated for systematic risk which is measured by Beta.


UNDERSTANDING STANDARD DEVIATION

Usually denoted with the letter σ, Standard Deviation is defined as the square root of the variance.

It basically serves as a measure of uncertainty. Volatile securities that have a higher standard deviation are also considered a higher risk because their performance may change quickly, in either direction and at any moment.

So the standard deviation of a fund measures this risk by measuring the degree to which the fund fluctuates in relation to its mean return i.e. the average return of a fund over a period.

For example, a fund that has a consistent four year return of 3%, would have a mean, or average of 3%. The standard deviation for this fund would then be zero because the fund's return in any given year does not differ from its four year mean of 3%.

The standard deviation of a set of data measures how "spread out" the data set is. In other words, it tells you whether all the data items bunch around close to the mean or if they are "all over the place."

What you need to take out of this is that the fund with the lower standard deviation would be more optimal because it is maximizing the return received, for risk acquired.

Imagine you have a choice between two stocks: Stock A historically returns 5% with a standard deviation of 10%, while Stock B returns 6% and carries a standard deviation of 20%, which one do you think is more risky?

Stock A has the potential to earn 10% more than the expected return, but is equally likely to earn 10% less than the expected return. Likewise Stock B can vary by up to 20%.

So on a risk and return perspective, Stock A is less risky than Stock B.

Share:

WHAT ARE MUTUAL FUNDS?

WHAT ARE MUTUAL FUNDS?

A mutual fund is a pool of money managed by a professional Fund Manager.
It is a trust that collects money from a number of investors who share a common investment objective and invests the same in equities, bonds, money market instruments and/or other securities. And the income / gains generated from this collective investment is distributed proportionately amongst the investors after deducting applicable expenses and levies, by calculating a scheme’s “Net Asset Value” or NAV. Simply put, the money pooled in by a large number of investors is what makes up a Mutual Fund.
Here’s a simple way to understand the concept of a Mutual Fund Unit.
Let’s say that there is a box of 12 chocolates costing ₹40. Four friends decide to buy the same, but they have only ₹10 each and the shopkeeper only sells by the box. So the friends then decide to pool in ₹10 each and buy the box of 12 chocolates. Now based on their contribution, they each receive 3 chocolates or 3 units, if equated with Mutual Funds.
And how do you calculate the cost of one unit? Simply divide the total amount with the total number of chocolates: 40/12 = 3.33.
So if you were to multiply the number of units (3) with the cost per unit (3.33), you get the initial investment of ₹10.
This results in each friend being a unit holder in the box of chocolates that is collectively owned by all of them, with each person being a part owner of the box.
Next, let us understand what is “Net Asset Value” or NAV. Just like an equity share has a traded price, a mutual fund unit has Net Asset Value per Unit. The NAV is the combined market value of the shares, bonds and securities held by a fund on any particular day (as reduced by permitted expenses and charges). NAV per Unit represents the market value of all the Units in a mutual fund scheme on a given day, net of all expenses and liabilities plus income accrued, divided by the outstanding number of Units in the scheme.
Mutual funds are ideal for investors who either lack large sums for investment, or for those who neither have the inclination nor the time to research the market, yet want to grow their wealth. The money collected in mutual funds is invested by professional fund managers in line with the scheme’s stated objective. In return, the fund house charges a small fee which is deducted from the investment. The fees charged by mutual funds are regulated and are subject to certain limits specified by the Securities and Exchange Board of India (SEBI).
India has one of the highest savings rate globally. This penchant for wealth creation makes it necessary for Indian investors to look beyond the traditionally favoured bank FDs and gold towards mutual funds. However, lack of awareness has made mutual funds a less preferred investment avenue.
Mutual funds offer multiple product choices for investment across the financial spectrum. As investment goals vary – post-retirement expenses, money for children’s education or marriage, house purchase, etc. – the products required to achieve these goals vary too. The Indian mutual fund industry offers a plethora of schemes and caters to all types of investor needs.
Mutual funds offer an excellent avenue for retail investors to participate and benefit from the uptrends in capital markets. While investing in mutual funds can be beneficial, selecting the right fund can be challenging. Hence, investors should do proper due diligence of the fund and take into consideration the risk-return trade-off and time horizon or consult a professional investment adviser. Further, in order to reap maximum benefit from mutual fund investments, it is important for investors to diversify across different categories of funds such as equity, debt and gold.
While investors of all categories can invest in securities market on their own, a mutual fund is a better choice for the only reason that all benefits come in a package.
A PLETHORA OF SCHEMES TO CHOOSE FROM
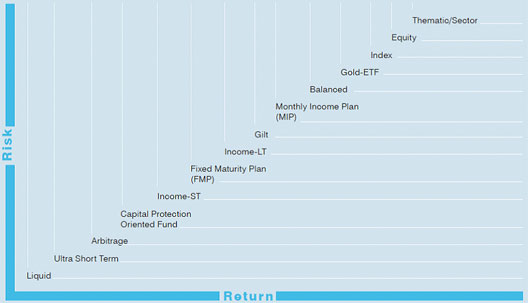
Mutual funds are favoured globally for the variety of investment options they offer. There is something for every profile and preference.
Chart 1: Risk/Return trade-off by mutual fund category
Risk/Return trade-off by mutual fund category
TYPE OF MUTUAL FUND SCHEMES
Mutual Fund schemes could be ‘open ended’ or close-ended’ and actively managed or passively managed.
OPEN-ENDED AND CLOSED-END FUNDS
An open-end fund is a mutual fund scheme that is available for subscription and redemption on every business throughout the year, (akin to a savings bank account, wherein one may deposit and withdraw money every day). An open ended scheme is perpetual and does not have any maturity date.
A closed-end fund is open for subscription only during the initial offer period and has a specified tenor and fixed maturity date (akin to a fixed term deposit). Units of Closed-end funds can be redeemed only on maturity (i.e., pre-mature redemption is not permitted). Hence, the Units of a closed-end fund are compulsorily listed on a stock exchange after the new fund offer, and are traded on the stock exchange just like other stocks, so that investors seeking to exit the scheme before maturity may sell their Units on the exchange.
ACTIVELY MANAGED AND PASSIVELY MANAGED FUNDS
An actively managed fund is a mutual fund scheme in which the fund manager “actively” manages the portfolio and continuously monitors the fund's portfolio , deciding on which stocks to buy/sell/hold and when, using his professional judgement, backed by analytical research. In an active fund, the fund manager’s aim is to generate maximum returns and out-perform the scheme’s bench mark.
A passively managed fund, by contrast, simply follows a market index, i.e., in a passive fund , the fund manager remains inactive or passive inasmuch as, she does not use her judgement or discretion to decide as to which stocks to buy/sell/hold , but simply replicates / tracks the scheme’s benchmark index in exactly the same proportion. Examples of Index funds are an Index Fund and all Exchange Traded Funds. In a passive fund, the fund manager’s task is to simply replicate the scheme’s benchmark index i.e., generate the same returns as the index, and not to out-perform the scheme’s bench mark.


Share:

SEBI order Dec 10 on Bajaj Finance plea in Karvy case, HDFC Bank, ICICI also go to SAT


Sebi’s prompt action against Karvy has resulted in nearly 83,000 investors getting back their securities. (Photo: Reuters)


Sebi’s prompt action against Karvy has resulted in nearly 83,000 investors getting back their securities. (Photo: Reuters)


  • Sebi has estimated the total exposure of lenders to Karvy at ₹2,800 crore
  • Bajaj Finance is aggrieved by the Sebi order, which prevents it from accessing its pledged shares
Mumbai: The Securities and Appellate Tribunal (SAT) on Tuesday gave Securities and Exchange Board of India (Sebi) time till 10 December to pass an order in the plea filed by Bajaj Finance Ltd against the capital market regulator’s move to transfer pledged shares to clients of the troubled Karvy Stock Broking Ltd.
Sebi has estimated the total exposure of lenders to Karvy at ₹2,800 crore, of which Bajaj Finance has an exposure of ₹345 crore as per a copy of the petition reviewed by Mint.
Bajaj Finance is aggrieved by the Sebi order, which prevents it from accessing its pledged shares. The firm claimed that it has the right to its pledged securities and that Sebi was wrong in returning the securities to the accounts of Karvy’s clients.
HDFC Bank Ltd, ICICI Bank Ltd and some other lenders also joined Bajaj Finance on Tuesday in its plea against the Sebi move. An order in their pleas will be passed later. SAT asked Sebi to hear Bajaj Finance’s plea by Wednesday.
Early on Monday, the National Stock Exchange of India Ltd (NSE) and the BSE suspended Karvy’s trading licence for all segments due to non-compliance with the exchange’s and Sebi norms. Multi Commodity Exchange (MCX) and MSEI also suspended the licence of the brokerage firm.\
This action follows the 22 November order by Sebi which had said the brokerage firm misused client securities and used it for other purposes. Karvy had sold clients securities and the proceeds were transferred to related party businesses such as Karvy Realty Ltd.
Sebi’s prompt action against Karvy has resulted in nearly 83,000 investors getting back their securities, which were illegally transferred by the brokerage firm to its own account and were even pledged without any authorisation.
With the latest transfer by National Securities Depository Ltd (NSDL), nearly 90% investors have got back their securities and the remaining ones will get after clearing their dues.
Karvy took loans to the tune of ₹600 crore by pledging securities worth more than ₹2,300 crore of 95,000 clients with lenders. Of these, 95,000 clients, nearly 83,000 of them have got their securities.
On 20 November, Bajaj Finance issued a loan recall notice to Karvy and the pledges against the loan would have been invoked on 23 November. Sebi had on 22 November barred depositories from transferring securities from Karvy’s account except to beneficial owners or clients who had paid in full. The petition also says Karvy had given a false undertaking to Bajaj Finance that these securities belonged to the brokerage.
https://www.livemint.com/market/stock-market-news/sebi-order-dec-10-on-bajaj-finance-plea-in-karvy-case-hdfc-bank-icici-also-go-to-sat-11575354685940.html

Share:

Recent Posts

Today's Quotes

“If you don't take care of your money your money won't take care of you.”


― Mac Duke The Strategist

Pages